Powerpeers – Energy Dashboard

Launch of the renewed energy dashboard

powerpeers_hero powerpeers_hero

About Powerpeers

Powerpeers.nl is a green and social digital platform where supply and demand for self-generated energy meet. Energy provider Powerpeers facilitates this by connecting customers with each other. Generators with a surplus of 100% green electricity are connected to consumers who need electricity but do not have solar panels. This way, sustainable energy is utilized optimally together.

gezin-zonnepanelen

The challenge

Sustainability, as well as the affordability of energy, is very important to customers. They also want information about the source of their energy. Powerpeers addresses this by providing customers with an online energy dashboard that offers insight into various aspects of energy consumption and costs. This helps customers make more conscious and sustainable choices. The old dashboard used outdated technology and was difficult for Powerpeers to maintain in terms of content.

Therefore, the decision was made to develop a new dashboard, in collaboration with Bikkelhart (functional design) and CodeCast (APIs). SowiesoDigital was tasked with developing and managing the new dashboard, utilizing the Powerpeers brand identity created by SowiesoHelder.


The result

SowiesoDigital handled the design and development of the new energy dashboard. The new dashboard transforms complex data on energy consumption into understandable and action-oriented information. It provides insights into usage and associated costs, and offers predictions for future consumption. Customers can quickly see how much energy they use annually, monthly, or daily, and how this compares to previous periods. A new feature also allows customers to view the payment status of each invoice.


The main additions are:

  • Payment plan advice

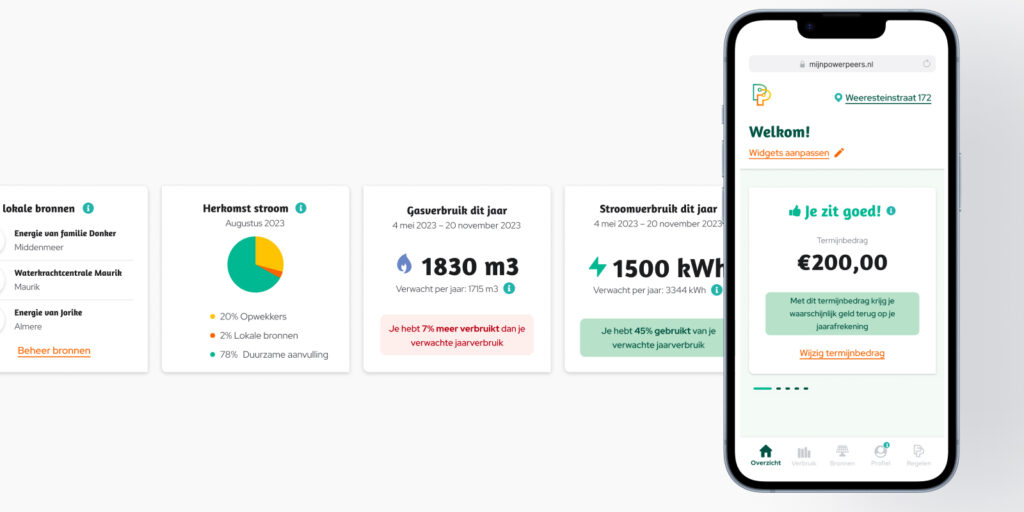
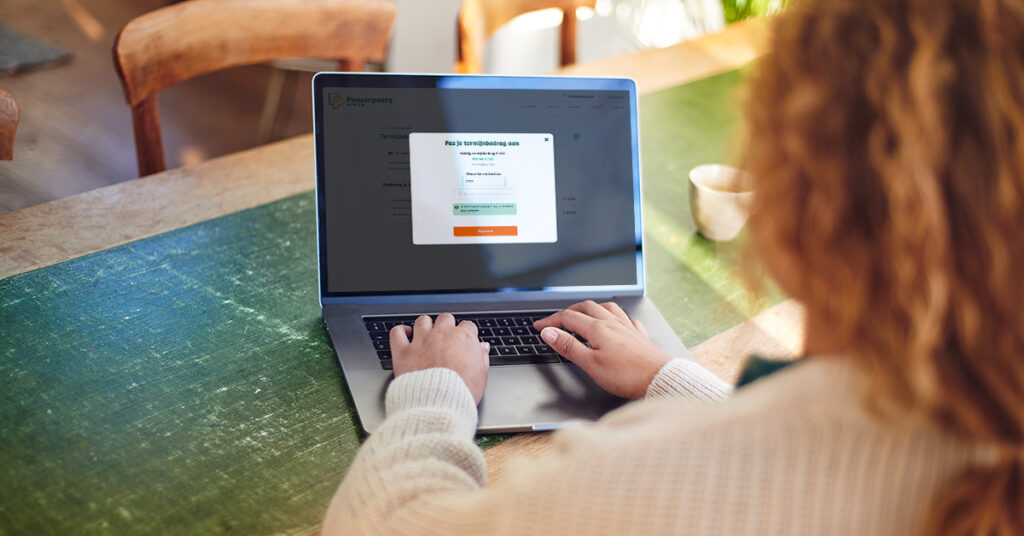
In the new energy dashboard, customers now receive advice on their monthly payment amount. This feature indicates whether the payment still aligns with the customer’s energy consumption. It gives them more control over costs and helps prevent any surprises on their annual statement.

  • Better insight into usage and costs

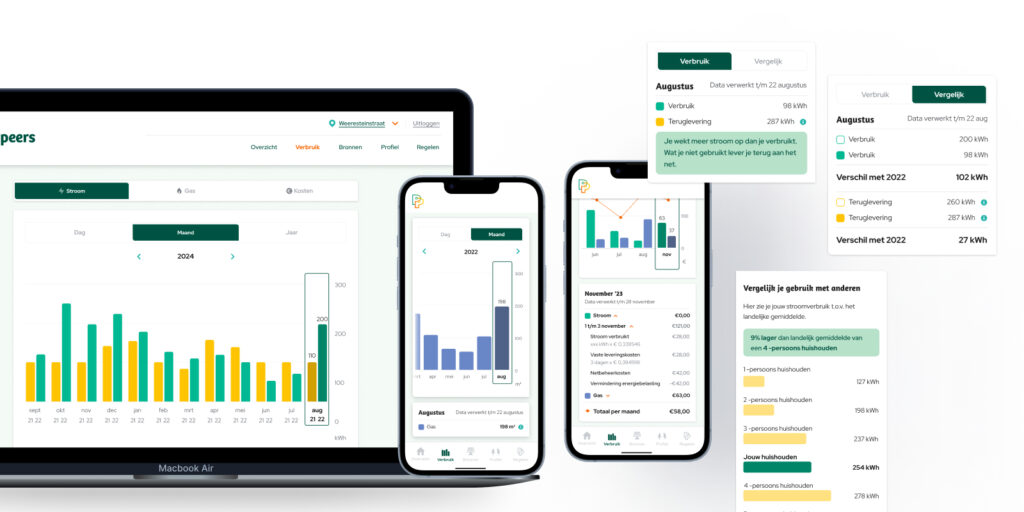
Customers can now view their energy costs not only per year and month but also per day. Additionally, they can easily compare their current usage with the same month from the previous year.

  • Customizable widgets

Customers can choose which information is displayed on the overview page. They can easily configure this by adding widgets and dragging them to their preferred location.

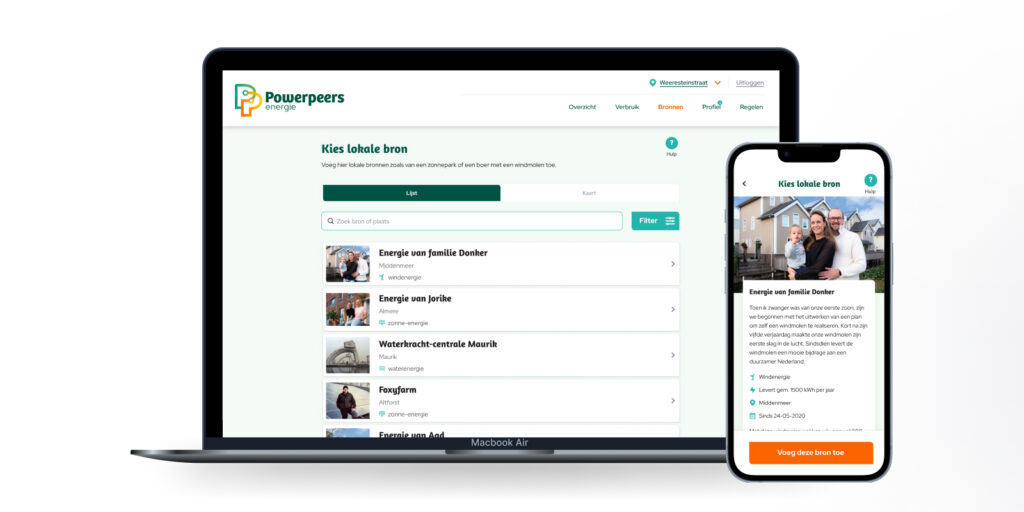
A unique feature of the Powerpeers dashboard is that users can select local sources (such as a farmer’s windmill or a large solar park) from which they wish to receive energy. This mix is then supplemented with purchased green electricity.

Technology and functionality

For the development of the platform, we chose the React framework. This provides scalability and optimal performance, both on desktop and on mobile devices such as tablets and smartphones. The Powerpeers dashboard is integrated with various external data sources for retrieving and processing information, such as account details, usage data, analytics, and payment systems.

User Experience (UX)

During the development process, there was a strong focus on user experience (UX). The needs of end users were central and were incorporated into Figma prototypes. For example, customers can now configure widgets on the homepage of the energy dashboard, making relevant data immediately visible. The intuitive interface and personalized recommendations ensure that customers can manage many tasks themselves without needing to contact the Powerpeers Service Desk.

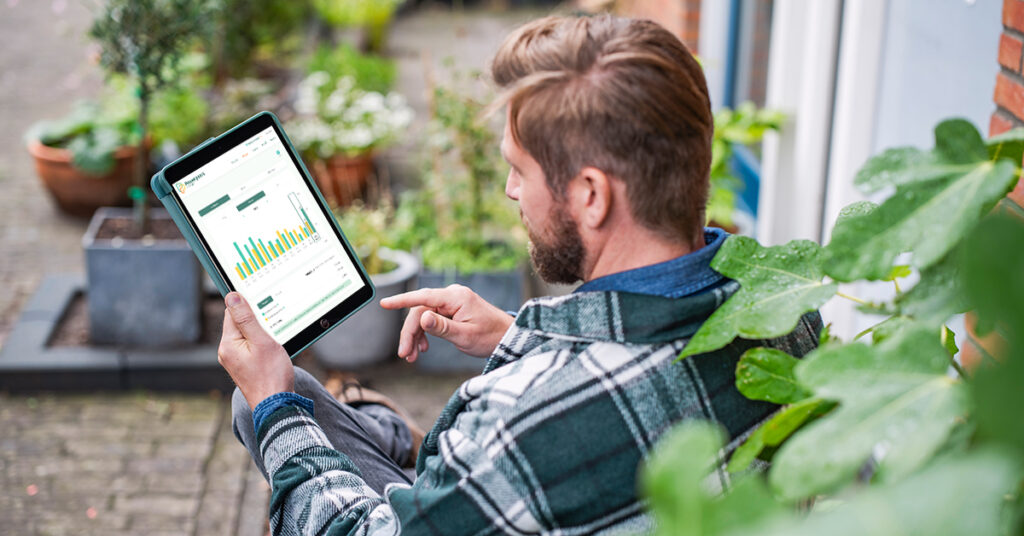
Facebook - ipad - verbruik
Widgets
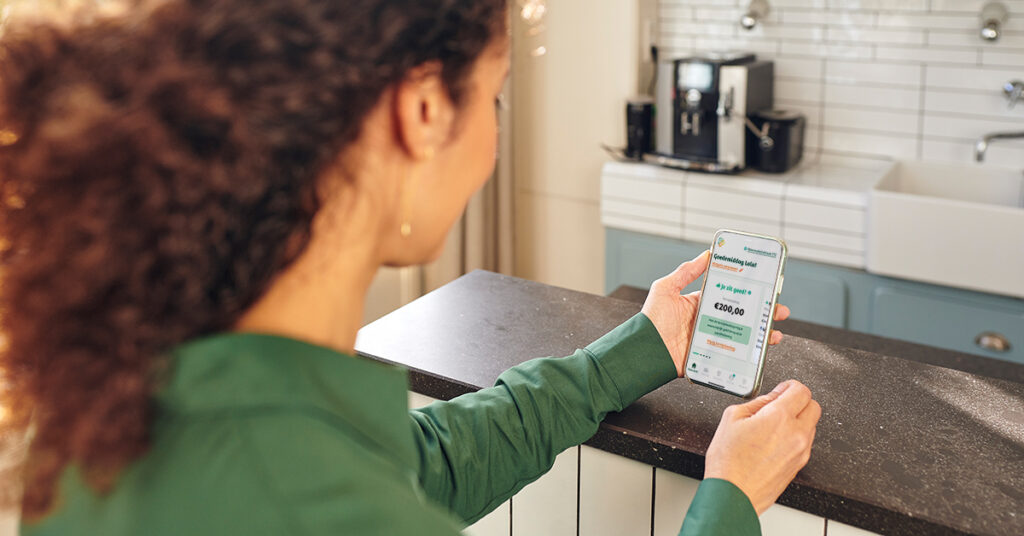
Facebook - mobile - overzichts
Verbruik
Facebook - laptop - termijn
Bronnen
Powerpeers dashboard 2x

Conclusion

The new energy dashboard from Powerpeers now provides customers with greater insight into their energy consumption and costs than before. Thanks to the intuitive interface and new features, users can easily make conscious choices and manage their energy usage. Through a combination of innovative technology and a customer-focused approach, the dashboard contributes to a more sustainable future for everyone.

Considering an application for your brand?

A user-friendly dashboard like this can also be valuable for your brand. We’d love to explore the possibilities for developing an online platform that fully meets your needs. Would you like to discuss this further soon?

start intake
Define
Web design Wireframes Functional design User Interface Design User Experience design Customer journey Personas
Services
Website development API development Web applications E-learning Webshop
Deploy
Hosting Website security Website maintenance Domain name registration Website analisys
Deliver
Conversion Rate Optimisation Google Advertising Search Engine Optimalisation Email Marketing Data-Driven Marketing Inbound Marketing Account-based Marketing
 
Customer relationship management Content Marketing Copywriting A/B Testing Usability Testing Landingpage Optimalisation Loyalty Program